fbpx
Connect with us

The Conversation

Sunflowers make small moves to maximize their Sun exposure − physicists can model them to predict how they grow

Published

on

theconversation.com – Chantal Nguyen, Postdoctoral Associate at the BioFrontiers Institute, of Colorado Boulder – 2024-09-13 07:31:40

Sunflowers use tiny movements to follow the Sun’s path throughout the day.

AP Photo/Charlie Riedel

Chantal Nguyen, University of Colorado Boulder

Advertisement

Most of us aren’t spending our days watching our houseplants grow. We see their signs of only occasionally – a new leaf unfurled, a stem leaning toward the window.

But in the summer of 1863, Charles Darwin lay ill in bed, with nothing to do but watch his plants so closely that he could detect their small movements to and fro. The tendrils from his cucumber plants swept in circles until they encountered a stick, which they proceeded to twine around.

“I am getting very much amused by my tendrils,” he wrote.

This amusement blossomed into a decadeslong fascination with the little-noticed world of plant movements. He compiled his detailed observations and experiments in a 1880 book called “The Power of Movement in Plants.”

Advertisement

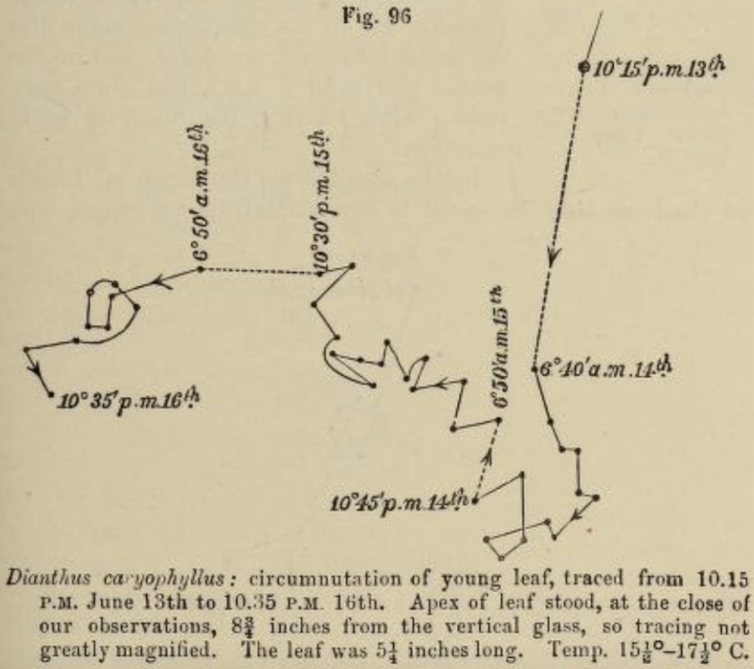
A zig-zagging line showing the movement of a leaf.

A diagram tracking the circumnutation of a leaf over three days.
Charles Darwin

In one study, he traced the motion of a carnation leaf every few hours over the course of three days, revealing an irregular looping, jagged path. The swoops of cucumber tendrils and the zags of carnation leaves are examples of inherent, ubiquitous plant movements called circumnutations – from the Latin circum, meaning circle, and nutare, meaning to nod.

Circumnutations vary in size, regularity and timescale across plant species. But their exact function remains unclear.

I’m a physicist interested in understanding collective behavior in living . Like Darwin, I’m captivated by circumnutations, since they may underlie more complex phenomena in groups of plants.

Advertisement

Sunflower patterns

A 2017 study revealed a fascinating observation that got my colleagues and me wondering about the role circumnutations could play in plant growth patterns. In this study, researchers found that sunflowers grown in a dense row naturally formed a near-perfect zigzag pattern, with each plant leaning away from the row in alternating directions.

This pattern the plants to avoid shade from their neighbors and maximize their exposure to sunlight. These sunflowers flourished.

Researchers then planted some plants at the same density but constrained them so that they could grow only upright without leaning. These constrained plants produced less oil than the plants that could lean and get the maximum amount of sun.

While farmers can’t grow their sunflowers quite this close together due to the potential for disease spread, in the future they may be able to use these patterns to up with new planting strategies.

Advertisement

Self-organization and randomness

This spontaneous pattern formation is a neat example of self-organization in nature. Self-organization refers to when initially disordered systems, such as a jungle of plants or a swarm of bees, achieve order without anything controlling them. Order emerges from the interactions between individual members of the system and their interactions with the .

Somewhat counterintuitively, noise – also called randomness – facilitates self-organization. Consider a colony of ants.

Ants secrete pheromones behind them as they crawl toward a food source. Other ants find this food source by the pheromone trails, and they further reinforce the trail they took by secreting their own pheromones in turn. Over time, the ants converge on the best path to the food, and a single trail prevails.

But if a shorter path were to become possible, the ants would not necessarily find this path just by following the existing trail.

Advertisement

If a few ants were to randomly deviate from the trail, though, they might stumble onto the shorter path and create a new trail. So this randomness injects a spontaneous change into the ants’ system that allows them to explore alternative scenarios.

Eventually, more ants would follow the new trail, and soon the shorter path would prevail. This randomness helps the ants adapt to changes in the environment, as a few ants spontaneously seek out more direct ways to their food source.

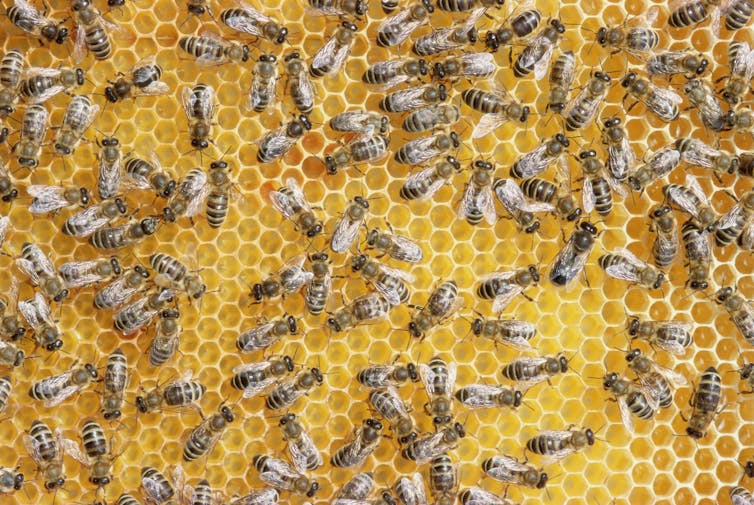
A group of honeybees spread out standing on honeycomb.

Beehives are an example of self-organization in nature.

Martin Ruegner/Stone via Getty Images

In biology, self-organized systems can be found at a range of scales, from the patterns of proteins inside cells to the socially complex colonies of honeybees that collectively build nests and forage for nectar.

Advertisement

Randomness in sunflower self-organization

So, could random, irregular circumnutations underpin the sunflowers’ self-organization?

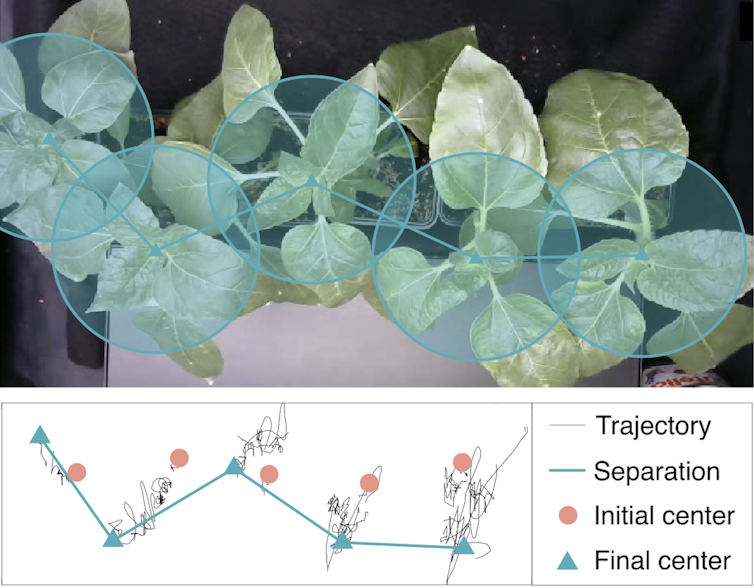
My colleagues and I set out to explore this question by following the growth of young sunflowers we planted in the lab. Using cameras that imaged the plants every five minutes, we tracked the movement of the plants to see their circumnutatory paths.

We saw some loops and spirals, and lots of jagged movements. These ultimately appeared largely random, much like Darwin’s carnation. But when we placed the plants together in rows, they began to move away from one another, forming the same zigzag configurations that we’d seen in the previous study.

Five plants and a diagram showing loops and jagged lines that represent small movements made by the plants.

Tracking the circumnutations made by young sunflower plants.

Chantal Nguyen
Advertisement

We analyzed the plants’ circumnutations and found that at any given time, the direction of the plant’s motion appeared completely independent of how it was moving about half an hour earlier. If you measured a plant’s motion once every 30 minutes, it would appear to be moving in a completely random way.

We also measured how much the plant’s leaves grew over the course of two weeks. By putting all of these results together, we sketched a picture of how a plant moved and grew on its own. This information allowed us to computationally model a sunflower and simulate how it behaves over the course of its growth.

A sunflower model

We modeled each plant simply as a circular crown on a stem, with the crown expanding according to the growth rate we measured experimentally. The simulated plant moved in a completely random way, taking a “step” every half hour.

We created the model sunflowers with circumnutations of lower or higher intensity by tweaking the step sizes. At one end of the spectrum, sunflowers were much more likely to take tiny steps than big ones, leading to slow, minimal movement on average. At the other end were sunflowers that are equally as likely to take large steps as small steps, resulting in highly irregular movement. The real sunflowers we observed in our experiment were somewhere in the middle.

Advertisement

Plants require light to grow and have evolved the ability to detect shade and alter the direction of their growth in response.

We wanted our model sunflowers to do the same thing. So, we made it so that two plants that get too close to each other’s shade begin to lean away in opposite directions.

Finally, we wanted to see whether we could replicate the zigzag pattern we’d observed with the real sunflowers in our model.

First, we set the model sunflowers to make small circumnutations. Their shade avoidance responses pushed them away from each other, but that wasn’t enough to produce the zigzag – the model plants stayed stuck in a line. In physics, we would call this a “frustrated” system.

Advertisement

Then, we set the plants to make large circumnutations. The plants started moving in random patterns that often brought the plants closer together rather than farther apart. Again, no zigzag pattern like we’d seen in the field.

But when we set the model plants to make moderately large movements, similar to our experimental measurements, the plants could self-organize into a zigzag pattern that gave each sunflower optimal exposure to light.

So, we showed that these random, irregular movements helped the plants explore their surroundings to find desirable arrangements that benefited their growth.

Plants are much more dynamic than people give them credit for. By taking the time to follow them, scientists and farmers can unlock their secrets and use plants’ movement to their advantage.The Conversation

Chantal Nguyen, Postdoctoral Associate at the BioFrontiers Institute, University of Colorado Boulder

Advertisement

This article is republished from The Conversation under a Creative Commons license. Read the original article.
Read More

The post Sunflowers make small moves to maximize their Sun exposure − physicists can model them to predict how they grow appeared first on .com

Advertisement

The Conversation

Tiny robots and AI algorithms could help to craft material solutions for cleaner environments

Published

on

theconversation.com – Mahshid Ahmadi, Assistant Professor of Materials Science and Engineering, of Tennessee – 2024-09-17 07:31:57

pollution is a global problem, but scientists are investigating new materials that could help clean it up.
AP Photo/Sergei Grits

Mahshid Ahmadi, University of Tennessee

Many human activities release pollutants into the air, and soil. These harmful chemicals threaten the of both people and the ecosystem. According to the World Health Organization, air pollution causes an estimated 4.2 million deaths annually.

Scientists are looking into solutions, and one potential avenue is a class of materials called photocatalysts. When triggered by light, these materials undergo chemical reactions that initial studies have shown can break down common toxic pollutants.

Advertisement

I am a materials science and engineering researcher at the University of Tennessee. With the help of robots and artificial intelligence, my colleagues and I are making and testing new photocatalysts with the goal of mitigating air pollution.

Breaking down pollutants

The photocatalysts work by generating charged carriers in the presence of light. These charged carriers are tiny particles that can move around and cause chemical reactions. When they into contact with water and oxygen in the , they produce substances called reactive oxygen species. These highly active reactive oxygen species can bond to parts of the pollutants and then either decompose the pollutants or turn them into harmless – or even useful – products.

A cube-shaped metal machine with a chamber filled with bright light, and a plate of tubes shown going under the light.
To facilitate the photocatalytic reaction, researchers in the Ahmadi lab put plates of perovskite nanocrystals and pollutants under bright light to see whether the reaction breaks down the pollutants.
Astita Dubey

But some materials used in the photocatalytic have limitations. For example, they can’t start the reaction unless the light has enough energy – infrared rays with lower energy light, or visible light, won’t trigger the reaction.

Another problem is that the charged particles involved in the reaction can recombine too quickly, which means they join back together before finishing the job. In these cases, the pollutants either do not decompose completely or the process takes a long time to accomplish.

Additionally, the surface of these photocatalysts can sometimes change during or after the photocatalytic reaction, which affects how they work and how efficient they are.

Advertisement

To overcome these limitations, scientists on my team are to develop new photocatalytic materials that work efficiently to break down pollutants. We also focus on making sure these materials are nontoxic so that our pollution-cleaning materials aren’t causing further pollution.

A plate of tiny tubes, with some colored dark blue, others light blue, and others transparent.
This plate from the Ahmadi lab is used while testing how perovskite nanocrystals and light break down pollutants, like the blue dye shown. The light blue color indicates partial degradation, while transparent water signifies complete degradation.
Astita Dubey

Teeny tiny crystals

Scientists on my team use automated experimentation and artificial intelligence to figure out which photocatalytic materials could be the best candidates to quickly break down pollutants. We’re making and testing materials called hybrid perovskites, which are tiny crystals – they’re about a 10th the thickness of a strand of hair.

These nanocrystals are made of a blend of organic (carbon-based) and inorganic (non-carbon-based) components.

They have a few unique qualities, like their excellent light-absorbing properties, which come from how they’re structured at the atomic level. They’re tiny, but mighty. Optically, they’re amazing too – they interact with light in fascinating ways to generate a large number of tiny charge carriers and trigger photocatalytic reactions.

These materials efficiently transport electrical charges, which allows them to transport light energy and drive the chemical reactions. They’re also used to make solar panels more efficient and in LED lights, which create the vibrant displays you see on TV screens.

Advertisement

There are thousands of potential types of hybrid nanocrystals. So, my team wanted to figure out how to make and test as many as we can quickly, to see which are the best candidates for cleaning up toxic pollutants.

Bringing in robots

Instead of making and testing samples by hand – which takes weeks or months – we’re using smart robots, which can produce and test at least 100 different materials within an hour. These small liquid-handling robots can precisely move, mix and transfer tiny amounts of liquid from one place to another. They’re controlled by a computer that guides their acceleration and accuracy.

A researcher in a white lab coat smiling at the camera next to a fume hood, with plates of small tubes inside it.
The Opentrons pipetting robot helps Astita Dubey, a visiting scientist working with the Ahmadi lab, synthesize materials and treat them with organic pollutants to test whether they can break down the pollutants.
Jordan Marshall

We also use machine learning to guide this process. Machine learning algorithms can analyze test data quickly and then learn from that data for the next set of experiments executed by the robots. These machine learning algorithms can quickly identify patterns and insights in collected data that would normally take much longer for a human eye to catch.

Our approach aims to simplify and better understand complex photocatalytic , helping to create new strategies and materials. By using automated experimentation guided by machine learning, we can now make these systems easier to analyze and interpret, overcoming challenges that were difficult with traditional methods.The Conversation

Mahshid Ahmadi, Assistant Professor of Materials Science and Engineering, University of Tennessee

This article is republished from The Conversation under a Creative Commons license. Read the original article.
Advertisement

Read More

The post Tiny robots and AI algorithms could help to craft material solutions for cleaner environments appeared first on .com

Continue Reading

The Conversation

A public health historian sizes up their records

Published

on

theconversation.com – Zachary W. Schulz, Lecturer of History, Auburn – 2024-09-17 07:33:53

The presidential debate on Sept. 10, 2024, did not add much context to what the two candidates would do on care beyond their own records.
Visual China Group/Getty Images

Zachary W. Schulz, Auburn University

Health care is a defining issue in the 2024 election – Democratic presidential nominee Kamala Harris and Republican contender Donald Trump have starkly different records on the issue. Rather than focusing on what they promise to do, let’s examine what their past actions reveal about their approaches to Medicare, the Affordable Care Act, public health infrastructure, drug policy and child abuse and domestic violence prevention.

As a specialist in public health history and policy, I have carefully examined both candidates’ records on American health care. With years of experience in the health care field and being a cystic fibrosis patient myself, I have developed a deep understanding of our health care system and the political dynamics that shape it.

Advertisement

For me, as for many other Americans, health care is more than just a political issue; it is a deeply personal one.

Medicare

During Harris’ time in the Senate, she co-sponsored the Medicare for All Act, which aimed to expand Medicare to all Americans, effectively eliminating private insurance.

At the presidential debate on Sept. 10, 2024, Harris clarified her former support of “Medicare for All” by emphasizing her prior legislative efforts to preserve and expand protections for patients’ rights and access to affordable health care.

Harris’s legislative efforts, primarily around the 2017-2020 period, reflect a commitment to broadening access to Medicare and reducing costs for seniors. During that time, Harris advocated for the Medicare program to negotiate drug prices directly with pharmaceutical companies.

Advertisement

Later, as vice president, Harris cast a tie-breaking vote on the 2022 Inflation Reduction Act, allowing the government to negotiate drug prices for Medicare with pharmaceutical companies.

In contrast, during Trump’s presidency, he made several attempts, some of which were successful, to cut funding for Medicare. The 2020 budget proposed by his administration included cuts to Medicare totaling more than US$800 billion over 10 years, primarily by reducing payments to providers and slowing the growth of the program.

The proposed cuts did not take effect because they required Congressional approval, which was not granted. The plan significant opposition due to concerns about potential negative impacts on beneficiaries.

Affordable Care Act

Harris has been a staunch defender of the Affordable Care Act, also known as the ACA or “Obamacare.” As a senator, Harris consistently voted against any efforts to repeal the ACA. She advocated for expanding its provisions, including supporting legislation that aimed to strengthen protections for people with preexisting conditions and increase funding for Medicaid expansion.

Advertisement

Harris’ record shows a clear commitment to ensuring broader health coverage under the ACA. And, in the recent debate, Harris noted this record and reasserted her commitment to the act.

During his presidency, Trump led multiple efforts to repeal the ACA, including the 2017 American Health Care Act, which would have significantly reduced the scope of expansion and individual mandates.

Although these efforts ultimately failed in the Senate, Trump succeeded in weakening the ACA by eliminating the individual mandate penalty through the 2017 Tax Cuts and Jobs Act. In the debate against Harris, Trump reiterated his position that the Affordable Care Act “was lousy health care,” though he did not ultimately offer a replacement plan, stating only that he has “concepts of a plan.”

Donald Trump claims that as president, he had an obligation to save Obamacare, otherwise known as the Affordable Care Act, but says it is too expensive. He says he has ‘concepts of a plan’ for something to replace the ACA.

Public health infrastructure

Harris’ tenure in the Senate, from January 2017 to January 2021, shows a consistent pattern of supporting public health infrastructure. She co-sponsored several bills aimed at increasing funding for community health centers and expanding access to preventive care.

Advertisement

Harris also advocated for more federal to address public health emergencies, such as the opioid epidemic and the COVID-19 pandemic.

During Trump’s presidency, however, he made significant cuts to public health programs. The Trump administration proposed budget cuts to the Centers for Disease Control and Prevention and other public health agencies, arguing that they were necessary for fiscal responsibility. These proposals drew criticism for potentially undermining the nation’s ability to respond to public health emergencies, a concern that was underscored by the CDC’s struggles during the early days of the pandemic. Trump frequently has responded to these criticisms by asserting he “cut bureaucratic red tape” rather than essential services.

Drug pricing policy

Harris has also supported legislation to lower drug prices and increase transparency in the pharmaceutical industry. She co-sponsored the Drug Price Relief Act, which aimed to allow the federal government to negotiate drug prices for Medicare directly. She also supported efforts to import cheaper prescription from Canada. Her record reflects a focus on reducing costs for consumers and increasing access to affordable medications.

Trump’s record on drug policy is mixed. While Trump took credit for some decreases in prescription drug prices during his presidency, his administration’s most significant regulatory changes favored pharmaceutical companies. The administration’s attempts to implement a rule allowing the importation of cheaper drugs from Canada faced significant hurdles and did not to immediate changes.

Advertisement

Trump also ended a rule that would have required pharmaceutical companies to disclose drug prices in television ads, citing concerns over its legality.

Child abuse and domestic violence

Harris has a strong record of advocating for the prevention of child abuse and domestic violence. During her time as California’s attorney general and as a senator, Harris pushed for legislation that increased funding for domestic violence prevention programs and expanded legal protections for survivors. She has consistently supported measures to enhance child welfare services and improve coordination among agencies to protect children.

Trump’s record on these issues is less defined, but his administration did sign into law the Family First Prevention Services Act, which aimed to keep more children safely at home and out of foster care by providing new resources to families. However, critics argue that the Trump administration’s broader cuts to social services and health programs could indirectly undermine efforts to combat child abuse and domestic violence. In addition, some experts suggest that Trump’s family separation policies on the southern border contributed to an increase in child trauma during his administration.The Conversation

Zachary W. Schulz, Lecturer of History, Auburn University

This article is republished from The Conversation under a Creative Commons license. Read the original article.

Advertisement

Read More

The post A public health historian sizes up their records appeared first on .com

Continue Reading

The Conversation

How researchers measure wildfire smoke exposure doesn’t capture long-term health effects − and hides racial disparities

Published

on

theconversation.com – Joan Casey, Associate Professor of Environmental and Occupational Health Sciences, University of Washington – 2024-09-16 07:26:33

Fine particulate matter from wildfires can cause long-term health harms.
Gary Hershorn/Getty Images

Joan Casey, University of Washington and Rachel Morello-Frosch, University of California, Berkeley

Kids born in 2020 worldwide will experience twice the number of wildfires during their lifetimes with those born in 1960. In California and other western states, frequent wildfires have become as much a part of summer and fall as popsicles and Halloween candy.

Wildfires produce fine particulate matter, or PM₂.₅, that chokes the air and penetrates deep into lungs. Researchers know that short-term exposure to wildfire PM₂.₅ increases acute care visits for cardiorespiratory problems such as asthma. However, the long-term effects of repeated exposure to wildfire PM₂.₅ on chronic health conditions are unclear.

Advertisement

One reason is that scientists have not decided how best to measure this type of intermittent yet ongoing exposure. Environmental epidemiologists and health scientists like us usually summarize long-term exposure to total PM₂.₅ – which from power plants, industry and transportation – as average exposure over a year. This might not make sense when measuring exposure to wildfire. Unlike traffic-related air pollution, for example, levels of wildfire PM₂.₅ vary a lot throughout the year.

To improve health and equity research, our team has developed five metrics that better capture long-term exposure to wildfire PM₂.₅.

Measuring fluctuating wildfire PM₂.₅

To understand why current measurements of wildfire PM₂.₅ aren’t adequately capturing an individual’s long-term exposure, we need to delve into the concept of averages.

Say the mean level of PM₂.₅ over a year was 1 microgram per cubic meter. A person could experience that exposure as 1 microgram per cubic meter every day for 365 days, or as 365 micrograms per cubic meter on a single day.

Advertisement

While these two scenarios result in the same average exposure over a year, they might have very different biological effects. The body might be able to fend off damage from exposure to 1 microgram per cubic meter each day, but be overwhelmed by a huge, single dose of 365 micrograms per cubic meter.

For perspective, in 2022, Americans experienced an average total PM₂.₅ exposure of 7.8 micrograms per cubic meter. Researchers estimated that in the 35 states that experience wildfires, these wildfires added on average just 0.69 micrograms per cubic meter to total PM₂.₅ each year from 2016 to 2020. This perspective misses the mark, however.

For example, a census tract close to the 2018 Camp Fire experienced an average wildfire PM₂.₅ concentration of 1.2 micrograms per cubic meter between 2006 to 2020. But the actual fire had a peak exposure of 310 micrograms per cubic meter – the world’s highest level that day.

Orange haze blanketing a city skyline, small silhouette of a person taking a photo by a streetlight
Classic estimates of average PM₂.₅ levels miss the peak exposure of wildfire events.
Angela Weiss/AFP via Getty Images

Scientists want to better understand what such extreme exposures mean for long-term human health. Prior studies on long-term wildfire PM₂.₅ exposure focused mostly on people living close to a large fire, up years later to check on their health status. This misses any new exposures that took place between baseline and follow-up.

More recent studies have tracked long-term exposure to wildfire PM₂.₅ that changes over time. For example, researchers reported associations between wildfire PM₂.₅ exposure over two years and risk of from cancer and any other cause in Brazil. This work again relied on long-term average exposure and did not directly capture extreme exposures from intermittent wildfire events. Because the study did not evaluate it, we do not know whether a specific pattern of long-term wildfire PM₂.₅ exposure was worse for health.

Advertisement

Most days, people experience no wildfire PM₂.₅ exposure. Some days, wildfire exposure is intense. As of now, we do not know whether a few very bad days or many slightly bad days are riskier for health.

A new framework

How can we get more realistic estimates that capture the huge peaks in PM₂.₅ levels that people are exposed to during wildfires?

When thinking about the wildfire PM₂.₅ that people experience, exposure scientists – researchers who study contact between humans and harmful agents in the – consider frequency, duration and intensity. These interlocking factors describe the body’s true exposure during a wildfire event.

In our recent study, our team proposed a framework for measuring long-term exposure to wildfire PM₂.₅ that incorporates the frequency, duration and intensity of wildfire events. We applied air quality models to California wildfire data from 2006 to 2020, deriving new metrics that capture a range of exposure types.

Advertisement
Five heat maps of California paired with bar graphs of exposures over time
The researchers proposed five ways to measure long-term wildfire PM₂.₅ exposure.
Casey et al. 2024/PNAS, CC BY-NC-ND

One metric we devised is number of days with any wildfire PM₂.₅ exposure over a long-term period, which can identify even the smallest exposures. Another metric is average concentration of wildfire PM₂.₅ during the peak week of smoke levels over a long period, which highlights locations that experience the most extreme exposures. We also developed several other metrics that may be more useful, depending on what effects are being studied.

Interestingly, these metrics were quite correlated with one another, suggesting places with many days of at least some wildfire PM₂.₅ also had the highest levels overall. Although this can make it difficult to decide between different exposure patterns, the suitability of each metric depends in part on what health effects we are investigating.

Environmental injustice

We also assessed whether certain racial and ethnic groups experienced higher-than-average wildfire PM₂.₅ exposure and found that different groups faced the most exposure depending on the year.

Consider 2018 and 2020, two major wildfire years in California. The most exposed census tracts, by all metrics, were composed primarily of non-Hispanic white individuals in 2018 and Hispanic individuals in 2020. This makes sense, since non-Hispanic white people constitute about 41.6% and Hispanic people 36.4% of California’s population.

To understand whether other groups faced excess wildfire PM₂.₅ exposure, we used relative comparisons. This means we compared the true wildfire PM₂.₅ exposure experienced by each racial and ethnic group with what we would have expected if they were exposed to the average.

Advertisement

We found that Indigenous communities had the most disproportionate exposure, experiencing 1.68 times more PM₂.₅ than expected. In comparison, non-Hispanic white Californians were 1.13 times more exposed to PM₂.₅ than expected, and multiracial Californians 1.09 times more exposed than expected.

Person holding child, sitting by two other people; in the foreground, a child approaches the camera
Better metrics for long-term PM2.5 exposure can help researchers better understand who’s most vulnerable to wildfire smoke.
Eric Thayer/Stringer via Getty Images News

Rural tribal lands had the highest mean wildfire PM₂.₅ concentrations – 0.83 micrograms per cubic meter – of any census tract in our study. A large portion of Native American people in California in rural areas, often with higher wildfire risk due to decades of poor forestry management, including legal suppression of cultural burning practices that studies have shown to aid in reducing catastrophic wildfires. Recent state legislation has removed liability risks of cultural burning on Indigenous lands in California.

Understanding the drivers and health effects of high long-term exposure to wildfire PM₂.₅ among Native American and Alaska Native people can help address substantial health disparities between these groups and other Americans.The Conversation

Joan Casey, Associate Professor of Environmental and Occupational Health Sciences, University of Washington and Rachel Morello-Frosch, Professor of Environmental Science, Policy and Management and of Public Health, University of California, Berkeley

This article is republished from The Conversation under a Creative Commons license. Read the original article.

Read More

Advertisement

The post How researchers measure wildfire smoke exposure doesn’t capture long-term health effects − and hides racial disparities appeared first on .com

Continue Reading

Trending