


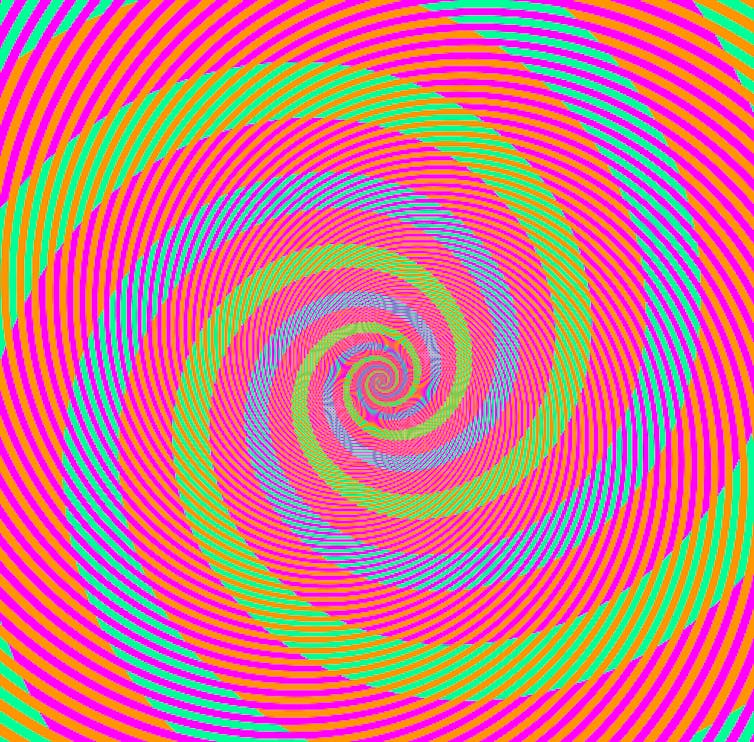
Akiyoshi Kitaoka
Elay Shech, Auburn University and Michael Watkins, Auburn University
Is your green my green? Probably not. What appears as pure green to me will likely look a bit yellowish or blueish to you. This is because visual systems vary from person to person. Moreover, an object’s color may appear differently against different backgrounds or under different lighting.
These facts might naturally lead you to think that colors are subjective. That, unlike features such as length and temperature, colors are not objective features. Either nothing has a true color, or colors are relative to observers and their viewing conditions.
But perceptual variation has misled you. We are philosophers who study colors, objectivity and science, and we argue in our book “The Metaphysics of Colors” that colors are as objective as length and temperature.
Perceptual variation
There is a surprising amount of variation in how people perceive the world. If you offer a group of people a spectrum of color chips ranging from chartreuse to purple and asked them to pick the unique green chip – the chip with no yellow or blue in it – their choices would vary considerably. Indeed, there wouldn’t be a single chip that most observers would agree is unique green.
Generally, an object’s background can result in dramatic changes in how you perceive its colors. If you place a gray object against a lighter background, it will appear darker than if you place it against a darker background. This variation in perception is perhaps most striking when viewing an object under different lighting, where a red apple could look green or blue.
Of course, that you experience something differently does not prove that what is experienced is not objective. Water that feels cold to one person may not feel cold to another. And although we do not know who is feeling the water “correctly,” or whether that question even makes sense, we can know the temperature of the water and presume that this temperature is independent of your experience.
Similarly, that you can change the appearance of something’s color is not the same as changing its color. You can make an apple look green or blue, but that is not evidence that the apple is not red.

Gyozo Vaczi/iStock via Getty Images Plus
For comparison, the Moon appears larger when it’s on the horizon than when it appears near its zenith. But the size of the Moon has not changed, only its appearance. Hence, that the appearance of an object’s color or size varies is, by itself, no reason to think that its color and size are not objective features of the object. In other words, the properties of an object are independent of how they appear to you.
That said, given that there is so much variation in how objects appear, how do you determine what color something actually is? Is there a way to determine the color of something despite the many different experiences you might have of it?
Matching colors
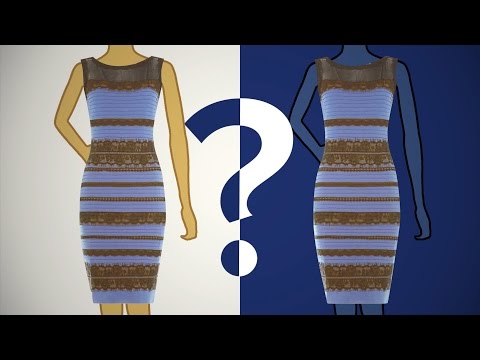
Perhaps determining the color of something is to determine whether it is red or blue. But we suggest a different approach. Notice that squares that appear to be the same shade of pink against different backgrounds look different against the same background.

Shobdohin/Wikimedia Commons, CC BY-SA
It’s easy to assume that to prove colors are objective would require knowing which observers, lighting conditions and backgrounds are the best, or “normal.” But determining the right observers and viewing conditions is not required for determining the very specific color of an object, regardless of its name. And it is not required to determine whether two objects have the same color.
To determine whether two objects have the same color, an observer would need to view the objects side by side against the same background and under various lighting conditions. If you painted part of a room and find that you don’t have enough paint, for instance, finding a match might be very tricky. A color match requires that no observer under any lighting condition will see a difference between the new paint and the old.
That two people can determine whether two objects have the same color even if they don’t agree on exactly what that color is – just as a pool of water can have a particular temperature without feeling the same to me and you – seems like compelling evidence to us that colors are objective features of our world.
Colors, science and indispensability
Everyday interactions with colors – such as matching paint samples, determining whether your shirt and pants clash, and even your ability to interpret works of art – are hard to explain if colors are not objective features of objects. But if you turn to science and look at the many ways that researchers think about colors, it becomes harder still.
For example, in the field of color science, scientific laws are used to explain how objects and light affect perception and the colors of other objects. Such laws, for instance, predict what happens when you mix colored pigments, when you view contrasting colors simultaneously or successively, and when you look at colored objects in various lighting conditions.
The philosophers Hilary Putnam and Willard van Orman Quine made famous what is known as the indispensability argument. The basic idea is that if something is indispensable to science, then it must be real and objective – otherwise, science wouldn’t work as well as it does.
For example, you may wonder whether unobservable entities such as electrons and electromagnetic fields really exist. But, so the argument goes, the best scientific explanations assume the existence of such entities and so they must exist. Similarly, because mathematics is indispensable to contemporary science, some philosophers argue that this means mathematical objects are objective and exist independently of a person’s mind.

Paul Starosta/Stone via Getty Images
Likewise, we suggest that color plays an indispensable role in evolutionary biology. For example, researchers have argued that aposematism – the use of colors to signal a warning for predators – also benefits an animal’s ability to gather resources. Here, an animal’s coloration works directly to expand its food-gathering niche insofar as it informs potential predators that the animal is poisonous or venomous.
In fact, animals can exploit the fact that the same color pattern can be perceived differently by different perceivers. For instance, some damselfish have ultraviolet face patterns that help them be recognized by other members of their species and communicate with potential mates while remaining largely hidden to predators unable to perceive ultraviolet colors.
In sum, our ability to determine whether objects are colored the same or differently and the indispensable roles they play in science suggest that colors are as real and objective as length and temperature.![]()
Elay Shech, Professor of Philosophy, Auburn University and Michael Watkins, Professor of Philosophy, Auburn University
This article is republished from The Conversation under a Creative Commons license. Read the original article.


