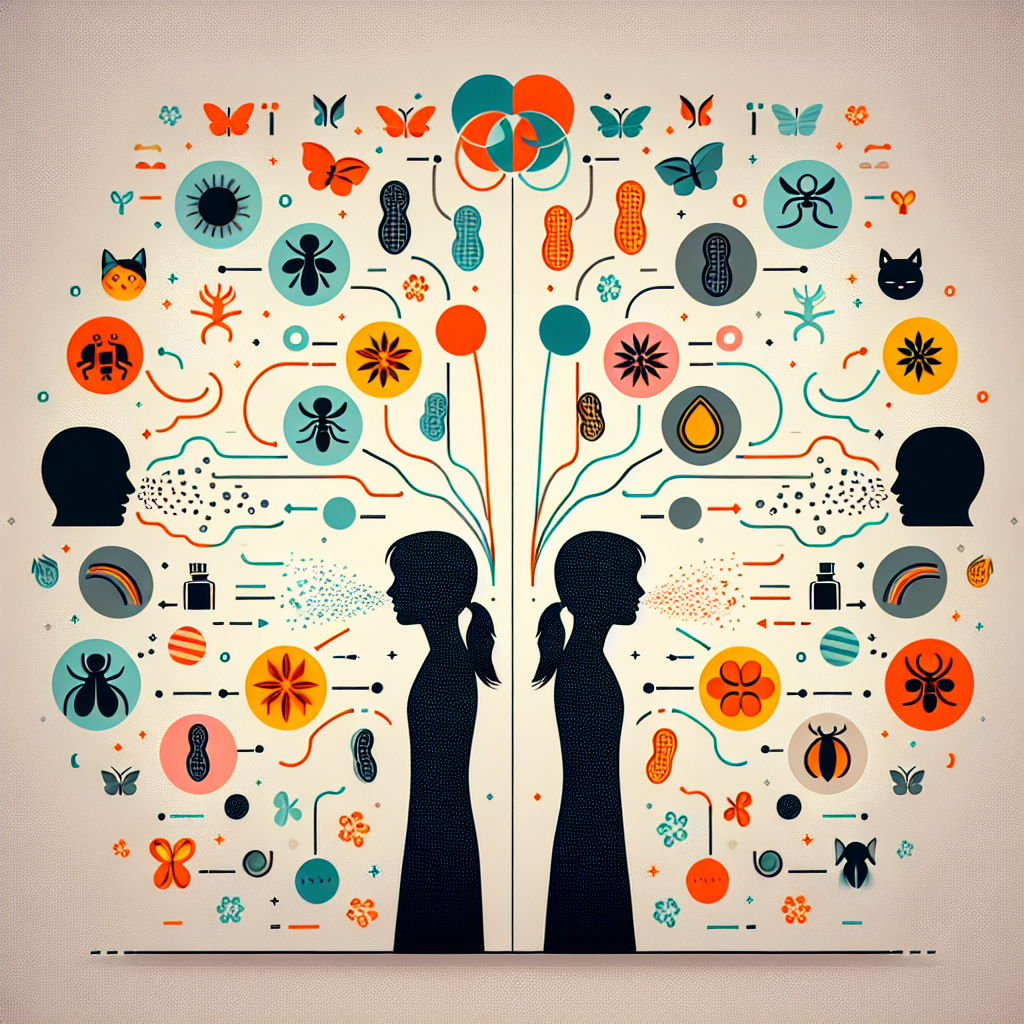
When bots – automated agents that perform tasks on behalf of humans – become more active in online communities, it has profound effects on how humans interact with each other on those platforms. Bots designed to help users see more content increase the number of people users connect with but also decrease the interactions between people.
In online communities, replies, likes and comments between users form a network of interactions. Analysis of these social networks shows patterns, such as who is connecting and who is popular or important in the community.
My colleagues Nicholas Berente and Hani Safadiand Ianalyzed the network structure of communities on Reddit, called subreddits, that had seen increased use of bots from 2005 to 2019. Our goal was to see whether the presence of bots affected how the human community members interacted with each other.
Based on recent research, we knew that we were looking for two types of bots: reflexive and supervisory bots.
Reflexive bots are coded to plug into a community’s application programming interface. Based on how they are coded, they either post content based on specific rules or search for specific content and post a reply based on their preprogrammed rules. Supervisory bots have more permissions in the community and can delete or edit posts or even ban users based on preprogrammed community moderation rules.
We found that when there is more reflexive bot activity in a community – more bots posting content – there are more human-to-human connections. This means that the reflexive bots posting content enable people to find novel content and engage with other users they otherwise would not have seen. However, this high bot activity leads to less back-and-forth discussion between users. If a user posts on a subreddit, it is more likely that a bot will reply or interject itself into the conversation instead of two human users engaging in a meaningful back-and-forth discussion.
When there are supervisory bots moderating a community, we see less centralization in the human social network. This means that those key people who were important to the community have fewer connections than before. Without supervisory bots, these members would be the ones who establish and enforce community norms. With supervisory bots, this is less necessary, and those human members are less central to the community.
Social media bots explained.
Why it matters
Bots are prevalent across online communities, and they can process vast amounts of data very quickly, which means they can react and respond to many more posts than humans can.
What’s more, as generative AI improves, people could use it to create more and more sophisticated bot accounts, and the platforms could use it to coordinate content moderation. Tech companies investing heavily in generative AI technologies could also deploy generative AI bots to increase engagement on their platforms.
Our study can help users and community leaders understand the impact of these bots on their communities. It can also help community moderators understand the impact of enabling automated moderation through supervisory bots.
What’s next
Bots are rigid because of their rules-based nature, but they are likely to become more advanced as they incorporate new technologies such as generative AI. More research will be needed to understand how complex generative AI bots affect human-to-human interactions in online communities.
At the same time, automating platform moderation can lead to strange effects, because bots are more rigid in their enforcement and cannot deal with potential issues on a case-by-case basis. How generative AI changes moderator bots remains to be seen.
The Research Brief is a short take on interesting academic work.
When someone sees something that isn’t there, people often refer to the experience as a hallucination. Hallucinations occur when your sensory perception does not correspond to external stimuli.
Technologies that rely on artificial intelligence can have hallucinations, too.
When an algorithmic system generates information that seems plausible but is actually inaccurate or misleading, computer scientists call it an AI hallucination. Researchers have found these behaviors in different types of AI systems, from chatbots such as ChatGPT to image generators such as Dall-E to autonomous vehicles. We are information scienceresearchers who have studied hallucinations in AI speech recognition systems.
Wherever AI systems are used in daily life, their hallucinations can pose risks. Some may be minor – when a chatbot gives the wrong answer to a simple question, the user may end up ill-informed. But in other cases, the stakes are much higher. From courtrooms where AI software is used to make sentencing decisions to health insurance companies that use algorithms to determine a patient’s eligibility for coverage, AI hallucinations can have life-altering consequences. They can even be life-threatening: Autonomous vehicles use AI to detect obstacles, other vehicles and pedestrians.
Making it up
Hallucinations and their effects depend on the type of AI system. With large language models – the underlying technology of AI chatbots – hallucinations are pieces of information that sound convincing but are incorrect, made up or irrelevant. An AI chatbot might create a reference to a scientific article that doesn’t exist or provide a historical fact that is simply wrong, yet make it sound believable.
In a 2023 court case, for example, a New York attorney submitted a legal brief that he had written with the help of ChatGPT. A discerning judge later noticed that the brief cited a case that ChatGPT had made up. This could lead to different outcomes in courtrooms if humans were not able to detect the hallucinated piece of information.
With AI tools that can recognize objects in images, hallucinations occur when the AI generates captions that are not faithful to the provided image. Imagine asking a system to list objects in an image that only includes a woman from the chest up talking on a phone and receiving a response that says a woman talking on a phone while sitting on a bench. This inaccurate information could lead to different consequences in contexts where accuracy is critical.
What causes hallucinations
Engineers build AI systems by gathering massive amounts of data and feeding it into a computational system that detects patterns in the data. The system develops methods for responding to questions or performing tasks based on those patterns.
Supply an AI system with 1,000 photos of different breeds of dogs, labeled accordingly, and the system will soon learn to detect the difference between a poodle and a golden retriever. But feed it a photo of a blueberry muffin and, as machine learning researchers have shown, it may tell you that the muffin is a chihuahua.
Object recognition AIs can have trouble distinguishing between chihuahuas and blueberry muffins and between sheepdogs and mops. Shenkman et al, CC BY
When a system doesn’t understand the question or the information that it is presented with, it may hallucinate. Hallucinations often occur when the model fills in gaps based on similar contexts from its training data, or when it is built using biased or incomplete training data. This leads to incorrect guesses, as in the case of the mislabeled blueberry muffin.
It’s important to distinguish between AI hallucinations and intentionally creative AI outputs. When an AI system is asked to be creative – like when writing a story or generating artistic images – its novel outputs are expected and desired. Hallucinations, on the other hand, occur when an AI system is asked to provide factual information or perform specific tasks but instead generates incorrect or misleading content while presenting it as accurate.
The key difference lies in the context and purpose: Creativity is appropriate for artistic tasks, while hallucinations are problematic when accuracy and reliability are required.
To address these issues, companies have suggested using high-quality training data and limiting AI responses to follow certain guidelines. Nevertheless, these issues may persist in popular AI tools.
Large language models hallucinate in several ways.
What’s at risk
The impact of an output such as calling a blueberry muffin a chihuahua may seem trivial, but consider the different kinds of technologies that use image recognition systems: An autonomous vehicle that fails to identify objects could lead to a fatal traffic accident. An autonomous military drone that misidentifies a target could put civilians’ lives in danger.
For AI tools that provide automatic speech recognition, hallucinations are AI transcriptions that include words or phrases that were never actually spoken. This is more likely to occur in noisy environments, where an AI system may end up adding new or irrelevant words in an attempt to decipher background noise such as a passing truck or a crying infant.
As these systems become more regularly integrated into health care, social service and legal settings, hallucinations in automatic speech recognition could lead to inaccurate clinical or legal outcomes that harm patients, criminal defendants or families in need of social support.
Check AI’s work
Regardless of AI companies’ efforts to mitigate hallucinations, users should stay vigilant and question AI outputs, especially when they are used in contexts that require precision and accuracy. Double-checking AI-generated information with trusted sources, consulting experts when necessary, and recognizing the limitations of these tools are essential steps for minimizing their risks.
Windstorms can seem like they come out of nowhere, hitting with a sudden blast. They might be hundreds of miles long, stretching over several states, or just in your neighborhood.
But they all have one thing in common: a change in air pressure.
Just like air rushing out of your car tire when the valve is open, air in the atmosphere is forced from areas of high pressure to areas of low pressure.
The stronger the difference in pressure, the stronger the winds that will ultimately result.
On this forecast for March 18, 2025, from the National Oceanic and Atmospheric Administration, ‘L’ represents low-pressure systems. The shaded area over New Mexico and west Texas represents strong winds and low humidity that combine to raise the risk of wildfires. NOAA Weather Prediction Center
Other forces related to the Earth’s rotation, friction and gravity can also alter the speed and direction of winds. But it all starts with this change in pressure over a distance – what meteorologists like me call a pressure gradient.
So how do we get pressure gradients?
Strong pressure gradients ultimately owe their existence to the simple fact that the Earth is round and rotates.
Because the Earth is round, the sun is more directly overhead during the day at the equator than at the poles. This means more energy reaches the surface of the Earth near the equator. And that causes the lower part of the atmosphere, where weather occurs, to be both warmer and have higher pressure on average than the poles.
Nature doesn’t like imbalances. As a result of this temperature difference, strong winds develop at high altitudes over midlatitude locations, like the continental U.S. This is the jet stream, and even though it’s several miles up in the atmosphere, it has a big impact on the winds we feel at the surface.
Wind speed and direction in the upper atmosphere on March 14, 2025, show waves in the jet stream. Downstream of a trough in this wave, winds diverge and low pressure can form near the surface. NCAR
Because Earth rotates, these upper-altitude winds blow from west to east. Waves in the jet stream – a consequence of Earth’s rotation and variations in the surface land, terrain and oceans – can cause air to diverge, or spread out, at certain points. As the air spreads out, the number of air molecules in a column decreases, ultimately reducing the air pressure at Earth’s surface.
The pressure can drop quite dramatically over a few days or even just a few hours, leading to the birth of a low-pressure system – what meteorologists call an extratropical cyclone.
In between these low-pressure and high-pressure systems is a strong change in pressure over a distance – a pressure gradient. And that pressure gradient leads to strong winds. Earth’s rotation causes these winds to spiral around areas of high and low pressure. These highs and lows are like large circular mixers, with air blowing clockwise around high pressure and counterclockwise around low pressure. This flow pattern blows warm air northward toward the poles east of lows and cool air southward toward the equator west of lows.
A map illustrates lines of surface pressure, called isobars, with areas of high and low pressure marked for March 14, 2025. Winds are strongest when isobars are packed most closely together. Plymouth State University, CC BY-NC-SA
As the waves in the jet stream migrate from west to east, so do the surface lows and highs, and with them, the corridors of strong winds.
That’s what the U.S. experienced when a strong extratropical cyclone caused winds stretching thousands of miles that whipped up dust storms and spread wildfires, and even caused tornadoes and blizzards in the central and southern U.S. in March 2025.
Whipping up dust storms and spreading fires
The jet stream over the U.S. is strongest and often the most “wavy” in the springtime, when the south-to-north difference in temperature is often the strongest.
Winds associated with large-scale pressure systems can become quite strong in areas where there is limited friction at the ground, like the flat, less forested terrain of the Great Plains. One of the biggest risks is dust storms in arid regions of west Texas or eastern New Mexico, exacerbated by drought in these areas.
A dust storm hit Albuquerque, N.M., on March 18, 2025. Another dust storm a few dats earlier in Kansas caused a deadly pileup involving dozens of vehices on I-70. AP Photo/Roberto E. Rosales
When the ground and vegetation are dry and the air has low relative humidity, high winds can also spread wildfires out of control.
Of course, winds can become even stronger and more violent on local scales associated with thunderstorms.
When thunderstorms form, hail and precipitation in them can cause the air to rapidly fall in a downdraft, causing very high pressure under these storms. That pressure forces the air to spread out horizontally when it reaches the ground. Meteorologists call these straight line winds, and the process that forms them is a downburst. Large thunderstorms or chains of them moving across a region can cause large swaths of strong wind over 60 mph, called a derecho.
Finally, some of nature’s strongest winds occur inside tornadoes. They form when the winds surrounding a thunderstorm change speed and direction with height. This can cause part of the storm to rotate, setting off a chain of events that may lead to a tornado and winds as strong as 300 mph in the most violent tornadoes.
How a tornado forms. Source: NOAA.
Tornado winds are also associated with an intense pressure gradient. The pressure inside the center of a tornado is often very low and varies considerably over a very small distance.
It’s no coincidence that localized violent winds from thunderstorm downbursts and tornadoes often occur amid large-scale windstorms. Extratropical cyclones often draw warm, moist air northward on strong winds from the south, which is a key ingredient for thunderstorms. Storms also become more severe and may produce tornadoes when the jet stream is in close proximity to these low-pressure centers. In the winter and early spring, cold air funneling south on the northwest side of strong extratropical cyclones can even lead to blizzards.
So, the same wave in the jet stream can lead to strong winds, blowing dust and fire danger in one region, while simultaneously triggering a tornado outbreak and a blizzard in other regions.
In the early days of the COVID-19 pandemic, researchers struggled to grasp the rate of the virus’s spread and the number of related deaths. While hospitals tracked cases and deaths within their walls, the broader picture of mortality across communities remained frustratingly incomplete.
Policymakers and researchers quickly discovered a troubling pattern: Many deaths linked to the virus were never officially counted. A study analyzing data from over 3,000 U.S. counties between March 2020 and August 2022 found nearly 163,000 excess deaths from natural causes that were missing from official mortality records.
Excess deaths, meaning those that exceed the number expected based on historical trends, serve as a key indicator of underreported deaths during health crises. Many of these uncounted deaths were later tied to COVID-19 through reviews of medical records, death certificates and statistical modeling.
In addition, lack of real-time tracking for medical interventions during those early days slowed vaccine development by delaying insights into which treatments worked and how people were responding to newly circulating variants.
Five years since the beginning of COVID-19, new epidemics such as bird flu are emerging worldwide, and researchers are still finding it difficult to access the data about people’s deaths that they need to develop lifesaving interventions.
How can the U.S. mortality data system improve? I’m a technology infrastructure researcher, and my team and I design policy and technical systems to reduce inefficiency in health care and government organizations. By analyzing the flow of mortality data in the U.S., we found several areas of the system that could use updating.
Critical need for real-time data
A death record includes key details beyond just the fact of death, such as the cause, contributing conditions, demographics, place of death and sometimes medical history. This information is crucial for researchers to be able to analyze trends, identify disparities and drive medical advances.
Approximately 2.8 million death records are added to the U.S. mortality data system each year. But in 2022 – the most recent official count available – when the world was still in the throes of the pandemic, 3,279,857 deaths were recorded in the federal system. Still, this figure is widely considered to be a major undercount of true excess deaths from COVID-19.
In addition, real-time tracking of COVID-19 mortality data was severely lacking. This process involves the continuous collection, analysis and reporting of deaths from hospitals, health agencies and government databases by integrating electronic health records, lab reports and public health surveillance systems. Ideally, it provides up-to-date insights for decision-making, but during the COVID-19 pandemic, these tracking systems lagged and failed to generate comprehensive data.
Getting real-time COVID-19 data from hospitals and other agencies into the hands of researchers proved difficult. Gerald Herbert/AP Photo
Without comprehensive data on prior COVID-19 infections, antibody responses and adverse events, researchers faced challenges designing clinical trials to predict how long immunity would last and optimize booster schedules.
Such data is essential in vaccine development because it helps identify who is most at risk, which variants and treatments affect survival rates, and how vaccines should be designed and distributed. And as part of the broader U.S. vital records system, mortality data is essential for medical research, including evaluating public health programs, identifying health disparities and monitoring disease.
At the heart of the problem is the inefficiency of government policy, particularly outdated public health reporting systems and slow data modernization efforts that hinder timely decision-making. These long-standing policies, such as reliance on paper-based death certificates and disjointed state-level reporting, have failed to keep pace with real-time data needs during crises such as COVID-19.
These policy shortcomings lead to delays in reporting and lack of coordination between hospital organizations, state government vital records offices and federal government agencies in collecting, standardizing and sharing death records.
History of US mortality data
The U.S. mortality data system has been cobbled together through a disparate patchwork of state and local governments, federal agencies and public health organizations over the course of more than a century and a half. It has been shaped by advances in public health, medical record-keeping and technology. From its inception to the present day, the mortality data system has been plagued by inconsistencies, inefficiencies and tensions between medical professionals, state governments and the federal government.
The first national efforts to track information about deaths began in the 1850s when the U.S. Census Bureau started collecting mortality data as part of the decennial census. However, these early efforts were inconsistent, as death registration was largely voluntary and varied widely across states.
In the early 20th century, the establishment of the National Vital Statistics System brought greater standardization to mortality data. For example, the system required all U.S. states and territories to standardize their death certificate format. It also consolidated mortality data at the federal level, whereas mortality data was previously stored at the state level.
However, state and federal reporting remained fragmented. For example, states had no unifom timeline for submitting mortality data, resulting in some states taking months or even years to finalize and release death records. Local or state-level paperwork processing practices also remained varied and at times contradictory.
To begin to close gaps in reporting timelines to aid medical researchers, in 1981 the National Center for Health Statistics – a division of the Centers for Disease Control and Prevention – introduced the National Death Index. This is a centralized database of death records collected from state vital statistics offices, making it easier to access death data for health and medical research. The system was originally paper-based, with the aim of allowing researchers to track the deaths of study participants without navigating complex bureaucracies.
As time has passed, the National Death Index and state databases have become increasingly digital. The rise of electronic death registration systems in recent decades has improved processing speed when it comes to researchers accessing mortality data from the National Death Index. However, while the index has solved some issues related to gaps between state and federal data, other issues, such as high fees and inconsistency in state reporting times, still plague it.
Accessing the data that matters most
With the Trump administration’s increasing removal of CDC public health datasets, it is unclear whether policy reform for mortality data will be addressed anytime soon.
Experts fear that the removal of CDC datasets has now set precedent for the Trump administration to cross further lines in its attempts to influence the research and data published by the CDC. The longer-term impact of the current administration’s public health policy on mortality data and disease response are not yet clear.
What is clear is that five years since COVID-19, the U.S. mortality tracking system remains unequipped to meet emerging public health crises. Without addressing these challenges, the U.S. may not be able to respond quickly enough to public health crises threatening American lives.