Connect with us

The Conversation

Soaring wealth inequality has remade the map of American prosperity

Published

on

theconversation.com – Tom Kemeny, Associate Professor, Munk School of Global Affairs & Public Policy, University of Toronto – 2025-01-16 07:54:00

New data highlights an increasing wealth divide across the United States.
pick-uppath/Getty Images

Tom Kemeny, University of Toronto

One need only glance at headlines about Jeff Bezos, Elon Musk and other super-wealthy individuals to understand that wealth in America is increasingly concentrated in fewer and fewer hands. Inequality is sharply on the rise.

Until now, however, little has been known about where the richest households are located, which cities are the most unequal and how these trends have evolved.

In a new analysis I conducted with my colleagues, we reveal where wealth is most concentrated within and between communities, cities and states. The result is GEOWEALTH-US – the first data that tracks the geography of wealth in the United States and how it has changed since 1960.

The overall picture is worrying. The wealthiest cities in the U.S. are now almost seven times richer than the poorest regions, a disparity that has almost doubled since 1960. Meanwhile, especially in urban coastal areas, wealth has become highly concentrated in the hands of a few. The picture from the geography of wealth suggests we are even more divided than we thought.

Mapping inequality

To measure wealth locally, we built precise models of household wealth, applying sophisticated machine learning techniques to data from the Federal Reserve’s survey of consumer finances.

We then used the models to estimate wealth among households in the decennial census and American community survey, where we can identify where people live.

Experts define wealth as the difference between the value of a household’s assets – cash, real estate and stocks, for example – and its liabilities, including mortgages, student loans and credit card debt. Wealth is also called “net worth.”

Using GEOWEALTH-US, we show that the wealth distribution across the U.S. has transformed since 1960. Inequality between the nation’s flourishing urban centers and other areas of the country, especially in parts of the South and Midwest, is higher than it has ever been over the previous 60 years.

The expansion of wealth inequality is a challenge to the American Dream: the notion that, with hard work, opportunity and prosperity are accessible to all.

Wealth enables choice and stability. Poorer households have more trouble providing the best nutrition and education for their children. Additionally, people growing up in lower-wealth households are less likely to spur innovation in a field or start successful new businesses. Wealth also profoundly affects one’s health, leaving the least wealthy in our society significantly more vulnerable to premature death and disability.

Large wealth gaps between places

We analyzed average household wealth across the U.S. between 1960 and 2022, using census-defined communities of about 100,000 residents.

At the community level, the lack of wealth can make a major difference in how well cities work for their residents.

People who grow up in wealthier places can reap benefits that span generations. As a result of property taxes and philanthropy, wealthier communities have greater resources for schools, health care, transportation and other infrastructure.

Good schools are one benefit of wealthy communities that may improve social mobility even for children born into poverty, studies suggest.

The map for 2022 reveals major disparities in typical (median) net worth across communities. Many of the least wealthy locations are in poor neighborhoods in some of America’s biggest cities – for instance, parts of the Bronx and East Harlem in New York, and areas of Houston and Milwaukee. A typical household in the five poorest communities had assets worth about $18,000. Many households in these locations held more debt than assets. Other wealth-poor areas of the country included parts of Baton Rouge, Louisiana, and Cincinnati, Ohio.

The wealthiest communities today tend to be found in urban coastal areas.

Palo Alto, California, and Nassau County, New York, are two of the nation’s five wealthiest places. The top five areas had median household net worth of nearly $1.7 million. That’s almost 90 times wealthier than the poorest five places.

These wealth divides help explain why, between 2019 and 2021, according to the school finance indicators database, the Palo Alto Unified School District in California spent about $7,000 more per student than the minimum required to achieve national benchmark test scores. Meanwhile, the East Baton Rouge school district spent almost $4,000 less per student than is required to meet those same national standards. Cincinnati Public Schools underspent by more than $9,000 per pupil.

Large wealth gaps within places

We also looked at wealth divides in cities and communities. Average wealth levels in a community matter, but so does their unequal distribution.

Inequality, especially when a community is racially diverse and spatially segregated, has been linked to underinvestment in public goods such as schools, roads and hospitals.

Our research identified large gaps in wealth within communities.

For example, in certain parts of California such as San Jose and Santa Monica, we found that the richest 10% of residents are about seven times wealthier than the median household. In contrast, in many parts of Utah and Minnesota, the wealthiest 10% of households are only about three times wealthier than the median household.

Coastal areas, then, are not simply wealthier than the rest of the country; wealth in these places is also less equally shared.

We also found that wealth is unequally distributed across many parts of the South. This reflects the legacy of slavery, discrimination and uneven economic development over generations.

Regardless of geography, across America we found that the most unequal places were likely to have larger populations of African Americans, Hispanics and other people of color. In these locations, white households were overrepresented among the wealthiest. Households of color, meanwhile, generally had much lower net worth.

The map of wealth is changing

Extensive testing shows that our model estimates wealth with a high level of accuracy. And by mapping household wealth rather than household income, which is what researchers more commonly use to assess economic well-being, we found that place-based divides are much worse than previously believed.

Our data shows that wealth gaps between places have grown much more than income gaps since 1960. By 2020, gaps in average wealth levels were about 60% higher than equivalent income gaps.

This appears to be driven by the changing economic fortunes of cities.

Average wealth levels in the San Francisco Bay Area, Seattle, New York and Boston have risen dramatically as these areas have cemented their leadership in high-technology sectors and finance.

The loss of manufacturing jobs, meanwhile, destroyed wealth in many American communities. In 1960, the industrial hub of Cleveland, Ohio, had among the highest levels of average household wealth in the country, according to our data. In 2020, Cleveland ranked 466th out of the 722 areas in our study.

Within cities, we also observed a rise in wealth concentration. In the Minneapolis metropolitan area, for instance, the share of total wealth held by the richest 0.1% of households has almost tripled, from about 3% in 1960 to almost 9% by 2020. This means that, compared with the past, just a few families there now own a much larger piece of the pie.

Ladder to success becoming harder to climb

Multiple factors may explain the growing pooling of wealth. They include the rising concentration of high-paying jobs in major metro areas and the explosive growth in housing values in these high-performing cities.

Changing federal tax policies have also favored the affluent at the expense of regular Americans.

If such policies continue under the next Trump administration, the divided geography of wealth may well grow worse – with significant consequences for U.S. democracy.The Conversation

Tom Kemeny, Associate Professor, Munk School of Global Affairs & Public Policy, University of Toronto

This article is republished from The Conversation under a Creative Commons license. Read the original article.

Read More

The post Soaring wealth inequality has remade the map of American prosperity appeared first on theconversation.com

The Conversation

Biden helped bring science out of the lab and into the community − emphasizing research focused on solutions

Published

on

theconversation.com – Arthur Daemmrich, Professor of Practice in the School for the Future of Innovation in Society, Arizona State University – 2025-01-17 08:17:00

Biden began his presidency in the throes of the COVID-19 pandemic.
Evan Vucci/AP Photo

Arthur Daemmrich, Arizona State University

President Joe Biden was inaugurated in January 2021 amid a devastating pandemic, with over 24 million COVID-19 cases and more than 400,000 deaths in the U.S. recorded at that point.

Operation Warp Speed, initiated by the Trump administration in May 2020, meant an effective vaccine was becoming available. Biden quickly announced a plan to immunize 100 million Americans over the next three months. By the end of April 2021, 145 million Americans – nearly half the population – had received one vaccine dose, and 103 million were considered fully vaccinated. Science and technology policymakers celebrated this coordination across science, industry and government to address a real-world crisis as a 21st-century Manhattan Project.

From my perspective as a scholar of science and technology policy, Biden’s legacy includes structural, institutional and practical changes to how science is conducted. Building on approaches developed over the course of many years, the administration elevated the status of science in the government and fostered community participation in research.

Raising science’s profile in government

The U.S. has no single ministry of science and technology. Instead, agencies and offices across the executive branch carry out scientific research at several national labs and fund research by other institutions. By elevating the White House Office of Science and Technology Policy to a Cabinet-level organization for the first time in its history, Biden gave the agency greater influence in federal decision-making and coordination.

Formally established in 1976, the agency provides the president and senior staff with scientific and technical advice, bringing science to bear on executive policies. Biden’s inclusion of the agency’s director in his Cabinet was a strong signal about the elevated role science and technology would play in the administration’s solutions to major societal challenges.

Under Biden, the Office of Science and Technology Policy established guidelines that agencies across the government would follow as they implemented major legislation. This included developing technologies that remove carbon dioxide from the atmosphere to address climate change, rebuilding America’s chip industry, and managing the rollout of AI technologies.

Close-up of gloved hand holding square semiconductor chip
The CHIPS and Science Act of 2022 boosted research and manufacture of semiconductor chips in the U.S.
Narumon Bowonkitwanchai/Moment via Getty Images

Instead of treating the ethical and societal dimensions of scientific and technological change as separate from research and development, the agency advocated for a more integrated approach. This was reflected in the appointment of social scientist Alondra Nelson as the agency’s first deputy director for science and society, and science policy expert Kei Koizumi as principal deputy director for policy. Ethical and societal considerations were added as evaluation criteria for grants. And initiatives such as the AI bill of rights and frameworks for research integrity and open science further encouraged all federal agencies to consider the social effects of their research.

The Office of Science and Technology Policy also introduced new ways for agencies to consult with communities, including Native Nations, rural Americans and people of color, in order to avoid known biases in science and technology research. For example, the agency issued government-wide guidance to recognize and include Indigenous knowledge in federal programs. Agencies such as the Department of Energy have incorporated public perspectives while rolling out atmospheric carbon dioxide removal technologies and building new hydrogen hubs.

Use-inspired research

A long-standing criticism of U.S. science funding is that it often fails to answer questions of societal importance. Members of Congress and policy analysts have argued that funded projects instead overly emphasize basic research in areas that advance the careers of researchers.

In response, the Biden administration established the technology, innovation and partnerships directorate at the National Science Foundation in March 2022.

The directorate uses social science approaches to help focus scientific research and technology on their potential uses and effects on society. For example, engineers developing future energy technologies could start by consulting with the community about local needs and opportunities, rather than pitching their preferred solution after years of laboratory work. Genetic researchers could share both knowledge and financial benefits with the communities that provided the researchers with data.

Fundamentally, “use-inspired” research aims to reconnect scientists and engineers with the people and communities their work ultimately affects, going beyond publication in a journal accessible only to academics.

The technology, innovation and partnerships directorate established initiatives to support regional projects and multidisciplinary partnerships bringing together researchers, entrepreneurs and community organizations. These programs, such as the regional innovation engines and convergence accelerator, seek to balance the traditional process of grant proposals written and evaluated by academics with broader societal demand for affordable health and environmental solutions. This work is particularly key to parts of the country that have not yet seen visible gains from decades of federally sponsored research, such as regions encompassing western North Carolina, northern South Carolina, eastern Tennessee and southwest Virginia.

Community-based scientific research

The Biden administration also worked to involve communities in science not just as research consultants but also as active participants.

Scientific research and technology-based innovation are often considered the exclusive domain of experts from elite universities or national labs. Yet, many communities are eager to conduct research, and they have insights to contribute. There is a decades-long history of citizen science initiatives, such as birdwatchers contributing data to national environmental surveys and community groups collecting industrial emissions data that officials can use to make regulations more cost effective.

Going further, the Biden administration carried out experiments to create research projects in a way that involved community members, local colleges and federal agencies as more equal partners.

Hand-drawn signs displayed on a fence against a green field, with messages about climate change around a sign that reads 'It's our future'
Collaboration between the community, academia, industry and government can lead to more effective solutions.
Deb Cohn-Orbach/UCG/Universal Images Group via Getty Images

For example, the Justice40 initiative asked people from across the country, including rural and small-town Americans, to identify local environmental justice issues and potential solutions.

The National Institutes of Health’s ComPASS program funded community organizations to test and scale successful health interventions, such as identifying pregnant women with complex medical needs and connecting them to specialized care.

And the National Science Foundation’s Civic Innovation Challenge required academic researchers to work with local organizations to address local concerns, improving the community’s technical skills and knowledge.

Frontiers of science and technology policy

Researchers often cite the 1945 report Science: The Endless Frontier, written by former Office of Scientific Research and Development head Vannevar Bush, to describe the core rationales for using American taxpayer money to fund basic science. Under this model, funding science would lead to three key outcomes: a secure national defense, improved health, and economic prosperity. The report, however, says little about how to go from basic science to desired societal outcomes. It also makes no mention of scientists sharing responsibility for the direction and impact of their work.

The 80th anniversary of Bush’s report in 2025 offers an opportunity to move science out into society. At present, major government initiatives are following a technology push model that focuses efforts on only one or a few products and involves little consideration of consumer and market demand. Research has repeatedly demonstrated that consumer or societal pull, which attracts development of products that enhance quality of life, is key to successful uptake of new technologies and their longevity.

Future administrations can further advance science and address major societal challenges by considering how ready society is to take up new technologies and increasing collaboration between government and civil society.The Conversation

Arthur Daemmrich, Professor of Practice in the School for the Future of Innovation in Society, Arizona State University

This article is republished from The Conversation under a Creative Commons license. Read the original article.

Read More

The post Biden helped bring science out of the lab and into the community − emphasizing research focused on solutions appeared first on theconversation.com

Continue Reading

The Conversation

China tech shrugged off Trump’s ‘trade war’ − there’s no reason it won’t do the same with new tariffs

Published

on

theconversation.com – Yu Zhou, Professor of Economic Geography, Vassar College – 2025-01-17 08:10:00

When it comes to slowing down China’s tech rise, tariffs won’t do the trick.
Costfoto/NurPhoto via Getty Images

Yu Zhou, Vassar College

When Donald Trump returns to the White House, he’ll be accompanied by a coterie of China hawks, all vowing to use tariffs and export bans to stop Beijing from challenging the United States’ supremacy in technology.

This isn’t entirely new; China has faced such trade pressure since Trump first became president in 2017, and it has continued through the Biden administration.

But the scale of what Trump now proposes – he has mentioned tariffs of up to 60% on goods from China – has some commentators suggesting that it could, in the words of one analyst, “keep Beijing on the defensive and permanently transform the rivalry in America’s favor.”

Such a view is premised on the belief that China’s outdated, state-subsidized, manufacturing-for-export model is ripe for disruption by U.S. tariffs.

But as someone who has studied China’s technology since the early 2000s and written and edited two books on China and innovation, I believe this portrayal of China’s economy is at least two decades out of date. China’s technological sectors have grown rapidly after 2016 by adapting to the imposition of American tariffs. Indeed, since the “trade war” launched by Trump in 2017, Chinese technology has actually emerged as a world leader.

China’s tech ascent

Thirty years ago, China barely had internet access, and its best technology company was yet to produce a competitive personal computer domestically. Fifteen years ago, it was the world’s factory – stuck at the low end of the value chain assembling iPhones and other tech gadgets, but not able to make any high-tech parts itself.

Even with the best crystal ball in the mid-2000s, no Chinese planners could have predicted the pathways to China’s technological standing today.

Fast-forward to today: China is now ahead of rival economies across broad technological fields. The think tank Information Technology and Innovation Foundation found in a 2024 report that China is leading or globally competitive in five out of nine high-tech sectors – robotics, nuclear power, electric vehicles, artificial intelligence and quantum computing – and rapidly catching up in four others: chemicals, machine tools, biopharmaceuticals and semiconductors. A Bloomberg analysis similarly identified China as leading or globally competitive in 12 out of 13 technology-intensive industries. And the Australian Strategic Policy Institute found China leading in 37 of 44 critical technologies it tracked.

Why has the Chinese tech industry advanced so quickly? Many in Washington believe it’s the result of decades of careful government planning to dominate global high-tech industries. But this, I believe, vastly overestimates Beijing’s foresight and control. The Chinese government has indeed maintained the lofty goal of catching up with the West since the 1980s, but having goals isn’t the same as being able to execute them.

A man in a white hazmat suit works at a desk.
An employee produces semiconductor chips at a factory in China’s Shandong province on Jan. 15, 2025.
STR/AFP via Getty Images

Many in the West also point at Chinese state subsidies propping up domestic tech firms. While subsidies have played a role in some tech successes, the Chinese government has also funded plenty of failures. Take semiconductors, for example: Despite enormous Chinese government investments since the 1990s, China still lags in producing cutting-edge chips and is reliant on imports.

Dare to D.R.E.A.M.

In my view, China’s technological dynamism didn’t come from the magic of central planning, but through five key elements I call D.R.E.A.M..

D denotes the dialogue between state and market.

While China’s government wields significant power, the country’s private sector is neither submissive nor powerless. In 2022, firms not owned by the state – mostly private firms but also offshore firms in which Beijing does not have a controlling share – accounted for 95% of enterprise R&D spending and 88% of urban employment.

While Beijing has cracked down on tech giants – it banned Alibaba’s Ant Group from listing on the New York Stock Exchange in 2020, and its COVID-19 lockdown hurt its private sector – the government is not, contrary to how it is seen by many in the West, bound by strict ideology. It has recently started to voice more support for the private sector, even drafting laws to protect private companies.

Indeed, it’s more accurate to describe state-market relations in China as dynamic, adaptive interaction – more dialogue than dictatorship.

R refers to the domestic research and development (R&D).

Once reliant on imported technology, China has invested heavily in domestic research capacity over the past 20 years. Geopolitical tensions accelerated a shift toward self-reliance, but Chinese scientists and engineers remain deeply engaged in global networks.

Further, a nominally anti-espionage program brought in under Trump’s first administration has swelled the number of highly skilled workers in China. The “China initiative” introduced by the U.S. Justice Department in 2018 promoted the suspicion – often without evidence – that Chinese and Chinese American scientists might be spying for Beijing, resulting in a flood of leading scientists heading back to China. There they continued to undertake cutting-edge research and educate a new generation of Chinese scientists.

E is for the industrial ecosystem China can exploit.

China’s vast manufacturing base enables rapid creation and scaling of new technologies. In 2023, China produced 35% of the global gross manufacturing output, being the only country covering all major industrial sectors.

China may not have the innovative ecosystem of Silicon Valley, which can draw on deep venture capital and a booming stock market. But it has built comprehensive supply chains over the years, and it’s exceptionally good at repurposing them to rapidly bring new products to market.

Take the example of robotics. China took the robotics industry seriously only when labor costs rose sharply. In 2010, China’s manufacturing labor costs were about $2 per hour, similar to the Philippines or Vietnam; by 2022, that figure rose to about $8 per hour – more than double the average of Southeast Asian countries.

China now installs more industrial robots annually than the rest of the world combined, and the quality of its robots has grown by leaps and bounds.

A stands for accumulative changes.

Rather than aiming for novel breakthroughs, Chinese companies excel at incremental improvements – and this results in an accumulative transforming effect. The massive manufacturing networks create opportunities to improve upon existing products based on market feedback, rather than a few brilliant ideas from any leader’s creative mind.

Analysts in the U.S. have long expected China’s rampant intellectual property violations to doom its innovation drive, the thinking being that it takes away the impetus for individuals to innovate if they believe such innovations will be stolen. Instead, as Taiwanese tech expert and writer Kai-Fu Lee has explained, Chinese enterprises can be dynamic and innovative in an environment with less IP protection. They often rapidly expand their market share and build business ecosystems to prevent followers from catching up.

M means the middle market.

Chinese firms tend to target middle-income consumers, both domestically and globally. By prioritizing affordability and functionality over cutting-edge innovation, they avoid head-to-head competition with Western giants such as Apple.

Chinese smartphone brands such as Xiaomi and Oppo are a third to half the price of an iPhone, but with similar functionalities. Chinese electric vehicles are similarly far less expensive than Tesla but still incorporate leading features.

Chinese firms tolerate lower profit margins, as they can rely on the expanded sales in the middle market, both domestically and, increasingly, overseas.

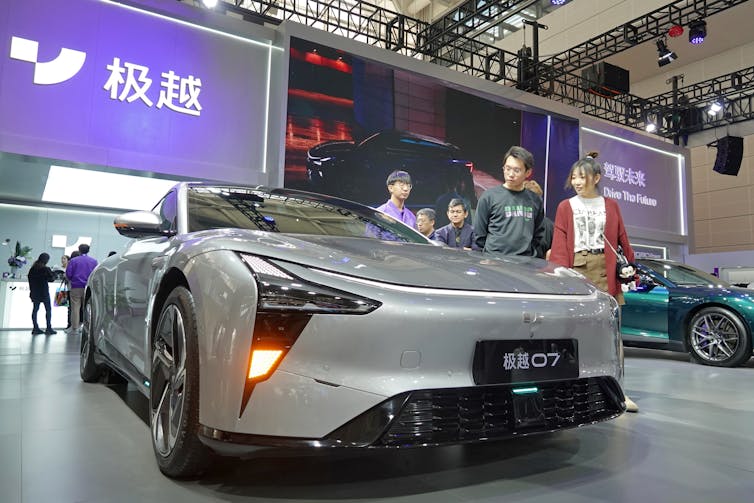
A man and a woman look at a car.
A JIDU 07 electric car draws attention at the 2024 China International Auto Show in Tianjin, China, on Oct. 3, 2024.
CFOTO/Future Publishing via Getty Images

Tariffs as a counterproductive measure

The problem for the incoming Trump administration is that while tariffs might alter the global map of China’s manufacturing and exports, they won’t dismantle any of the D.R.E.A.M. elements. In fact, they could have the opposite effect of accelerating China’s push for self-reliance and strengthening its foothold in global middle markets.

Part of the problem is that American policymakers often see technological competition with China as a zero-sum contest. But technological competition isn’t like a race with distinct lanes and a finish line. Rather, tech transformation is a complex process in which countries and companies compete, collaborate and build on each other’s work.

Ultimately, America’s technological prowess won’t be measured by how much it manages to stop China, but by how successfully American companies can address humanity’s greatest challenges. Attempts to hobble the competition through tariffs and trade wars will do little toward that end.The Conversation

Yu Zhou, Professor of Economic Geography, Vassar College

This article is republished from The Conversation under a Creative Commons license. Read the original article.

Read More

The post China tech shrugged off Trump’s ‘trade war’ − there’s no reason it won’t do the same with new tariffs appeared first on theconversation.com

Continue Reading

The Conversation

News coverage boosts giving after disasters – Australian research team’s findings may offer lessons for Los Angeles fires

Published

on

theconversation.com – Cassandra Chapman, Associate Professor, The University of Queensland – 2025-01-17 08:09:00

People who lost their possessions in the fire that swept through Altadena, Calif., look through donated shoes and clothing on Jan. 15, 2025.
AP Photo/Richard Vogel

Cassandra Chapman, The University of Queensland

In late 2019 and early 2020, a series of devastating wildfires, known as the “black summer” bushfire disaster, left Australia reeling: More than 20% of the country’s forests burned.

As a scholar of the psychology of charitable giving, I have long been interested in the unique emotional response that disasters evoke – often generating an urgent and visceral wish to help.

I wanted to understand how and why people respond to a crisis of this magnitude. For the project, I teamed up with three Australian environmental psychology and collective action experts: Matthew Hornsey, Kelly Fielding and Robyn Gulliver.

We found that international media coverage of disasters can help increase donations. Our findings, which were published in the peer-reviewed academic journal Disasters in 2022, are relevant to the situation in Los Angeles, where severe fires destroyed thousands of homes and businesses in January 2025, devastating many communities.

That recovery could take years.

5 key factors affect generosity

All told, Australian donors gave more than US$397 million, or $640 million in Australian dollars, to support the recovery from the black summer bushfire disaster. The international community also rallied: U.S. and U.K. donors contributed an additional US$2.6 million. These donations were used to fund evacuation centers, support groups for victims, and cash grants for repairs and rebuilding, among other things.

When we surveyed 949 Australians about what influenced their donations and analyzed news articles about the disaster, we found that coverage of disasters significantly increased generosity and influenced which charities drew donations. This may be because news articles communicated directly the need for charitable support.

Using this survey data, we identified key factors that influenced how much money, if any, people donated in response to the bushfire disaster appeals. These five were linked with the amounts Australians donated:

Scale: The sheer scale of the fires.

Personal impact: Having been personally affected, knowing people who have been affected, or being worried that they will be affected in the future.

Climate change beliefs: Believing that climate change is impacting the environment.

News footage: The dramatic footage of the fires they have seen.

Stories: The stories of those who have been affected.

Three of these factors – scale, news footage and stories – relate to information people were exposed to in media coverage of the disaster. Further, when we asked people how they chose which charities to support, they said that media coverage was more influential than either their friends and family or direct communication from those same charities.

These findings collectively show how media coverage can powerfully influence both how much people give to disaster relief and which nonprofits they choose to support.

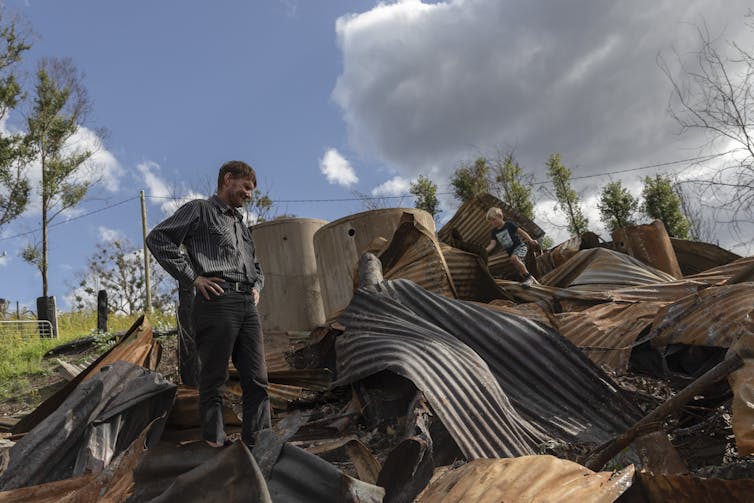
A man and a child stand amid wreckage that's been burned.
Bushfire survivor Ian Livingston and his son Sydney stand in the ruins of their family home, lost to the ‘black summer’ bushfires in May 2020 in Cobargo, Australia.
Brook Mitchell/Getty Images

Setting the agenda

In the next phase of our research, we tried to learn how media coverage affects the public’s generosity.

We downloaded every news article we could find about the disaster over the three-month period that fires raged and analyzed the text of 30,239 news articles using Linguistic Inquiry and Word Count software.

We looked at which kinds of language and concepts were being used in media coverage, and how frequently they were used compared with their use in everyday written language.

In addition to concepts we expected to see, like emergency, heroes and human loss, we found that the concepts of support and money frequently showed up in coverage. Words like “donations,” “help” and “support” occurred in 74% of news articles. Words having to do with money were even more common: They appeared almost twice as often as they do in ordinary written language.

Our findings suggest that news coverage may have helped to set the agenda for the huge charitable response to Australia’s wildfire disaster because the media told people what they should be thinking about in terms of that disaster. In Australia’s case, it was how they could help.

A consideration for the media

We also believe that it’s likely that news coverage of disasters like this one can serve an agenda-setting function by teaching the public how to think about the crisis.

To the extent that news coverage highlights concepts like support, possibly communicating that donating is a normal response to a crisis, it’s reasonable to expect people to donate more money.

Given that news coverage can influence how much someone donates, as well as which charities they choose to support, nonprofits responding to the Los Angeles fires may wish to encourage media outlets to mention their work in news coverage.

It is likely that being featured in news coverage – especially when calls to action or opportunities to donate are incorporated in an article – would result in more funds being raised for the charity’s response to the disaster.The Conversation

Cassandra Chapman, Associate Professor, The University of Queensland

This article is republished from The Conversation under a Creative Commons license. Read the original article.

Read More

The post News coverage boosts giving after disasters – Australian research team’s findings may offer lessons for Los Angeles fires appeared first on theconversation.com

Continue Reading

Trending